
Price per m² by municipality in Belgium: how to read the differences

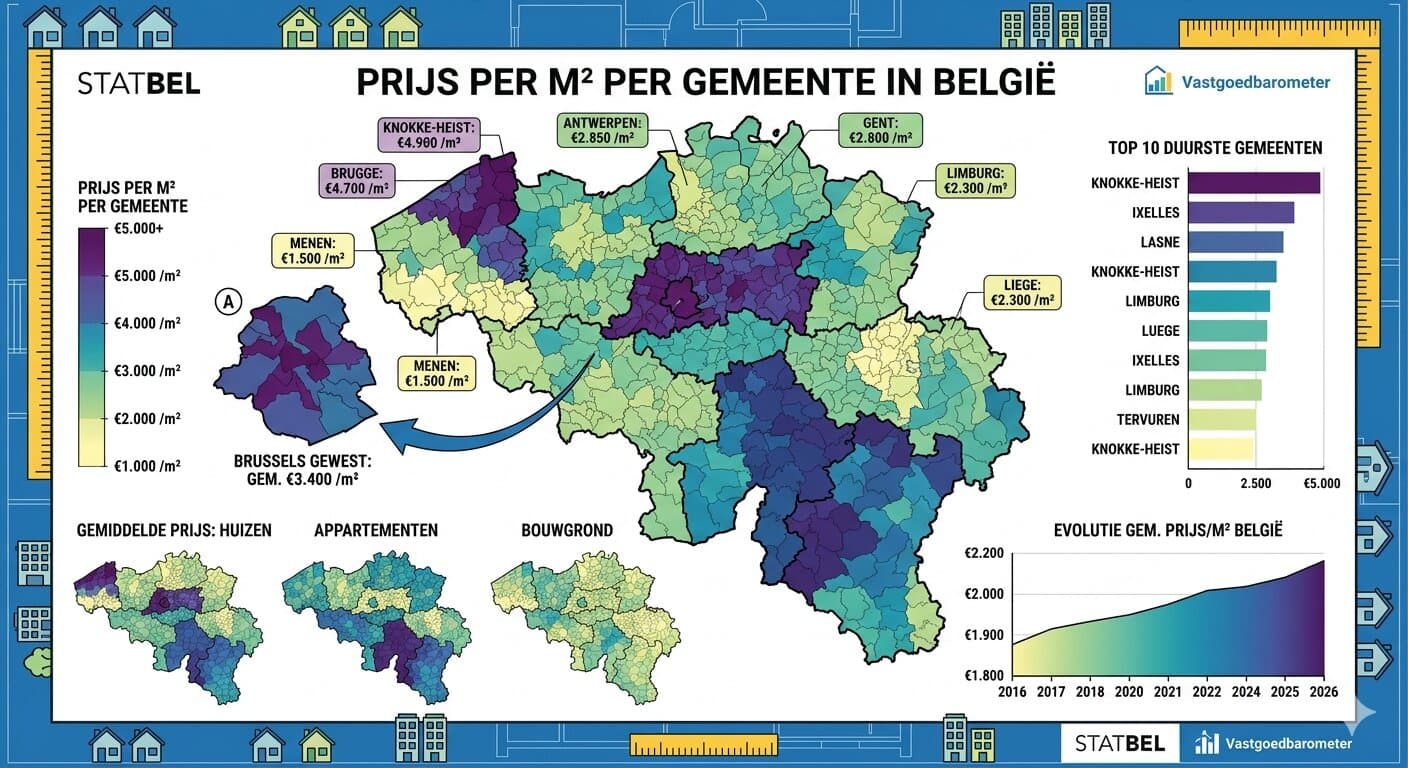
The price per m² by municipality in Belgium is one of the most useful benchmarks for quickly understanding differences in the property market. It shows where homes are more expensive or more affordable, and how strongly location, property type and local demand influence prices. Whether you want to buy or sell a property, the price per square metre gives you a far sharper picture than an absolute sale price alone.
In Belgium, these figures vary clearly from one municipality to the next. Statbel publishes property prices at municipal level for both houses and apartments, making it possible to track local market differences with precision. For buyers and sellers alike, this is particularly valuable, as it helps set realistic expectations around price, budget and room for negotiation.
Based on Statbel data for the first quarter of 2026, median house prices in Belgium continue to show significant regional variation - with Flemish coastal municipalities and the Brussels periphery sitting at one end of the scale, and parts of Wallonia at the other. Understanding where your municipality sits within that range is a practical starting point for any buying or selling decision.
What does price per m² mean?
The price per m² shows how much a property costs on average per square metre of living space. This makes it easier to compare different properties or municipalities, even when the buildings are not identical. In a market where size, location and property type vary considerably, it is a practical point of reference.
That said, this metric should be used with some nuance. An apartment often has a different price per m² from a house, and a city-centre municipality differs considerably from a rural one. The price per square metre tells you a great deal, but not everything. It works best as one of several tools rather than a single deciding factor.
✦ 100% free & No obligation
Sell your property with the best agent
Compare the top 3 agents in your region for free and save on commission.
Compare agents →Why look at individual municipalities?
Municipalities matter more in property than many people realise. Within the same province, prices can vary considerably depending on accessibility, amenities, planning pressure and demand. That is why the price per m² by municipality in Belgium is a more useful tool than a straightforward provincial average.
According to Statbel, property prices are indeed grouped by municipality, district, province and region. This enables local analysis and provides a more realistic picture of the market. For anyone looking to buy or sell, this is often more practical than a national median.
A good approach is to start with the municipality you have in mind, then look at one or two neighbouring municipalities for comparison. Sometimes a municipality just a few kilometres away offers a meaningfully different price level, with a very similar living environment. That comparison can open up options you might not otherwise have considered.
Differences between property types
Houses and apartments do not follow the same price curve. In Belgium, apartments generally show a different price per m² from houses, and within both categories there are significant differences between municipalities. An apartment in a city-centre municipality can therefore cost more per square metre than a house in a peripheral municipality.
You should therefore always compare within the same property type. Comparing the price per m² of a house with that of an apartment can give a distorted picture. The nature of the property is often just as important as the municipality itself.
Within the house category, open, semi-detached and terraced houses also follow different price lines. A terraced house typically shows a lower price per m² than a detached villa, even within the same municipality. Similarly, new-build apartments tend to carry a higher price per m² than older stock, partly because of higher energy performance standards and lower maintenance costs. Keep these distinctions in mind whenever you are using municipal averages as a reference point.
More expensive and more affordable municipalities
The most expensive municipalities are often found in highly sought-after regions, coastal towns or affluent residential suburbs. In media coverage and data overviews, Knokke-Heist, Nieuport and Kraainem frequently appear as the municipalities with the highest price per square metre. This illustrates how strongly exclusivity and scarcity weigh on the market.
At the other end of the scale, some municipalities show a considerably lower price per m². Available market data highlights, for example, that certain Walloon municipalities and industrial or less centrally located towns are priced much more accessibly. This makes the spread across Belgium particularly wide.
In the Brussels periphery, municipalities such as Wezembeek-Oppem, Tervuren and Lasne consistently rank among the most expensive outside the coastal strip, driven by high demand from professional households and limited available land. Within Brussels itself, figures from mid-2026 point to Saint-Gilles and Ixelles as the most expensive communes, while Anderlecht and Molenbeek remain more accessible - though prices there have been rising steadily. In Antwerp province, the city centre and the Zuidrand municipalities sit at the top, while more rural areas to the east and north offer more competitive entry points.
What does the price per m² reveal about the market?
A high price per m² usually signals strong demand, limited building land or a very desirable location. A lower price per m² may indicate greater supply, weaker demand or a different residential structure. But you should not automatically attach a quality label to either figure.
Sometimes a lower price per m² is simply the result of larger properties, older buildings or less urban pressure. Conversely, a high price per m² can go hand in hand with compact apartments or coastal municipalities with fierce competition. Local context therefore remains important.
One practical signal worth watching is the gap between asking prices and actual transaction prices in a given municipality. In a heated market, properties regularly sell above the asking price, which means the published median can lag behind real conditions. Tracking the number of active listings alongside the median price gives a more complete picture of supply and demand balance.
How do you use this information as a buyer?
As a buyer, the price per m² by municipality helps you quickly assess whether an asking price seems reasonable. You can check whether a property is in line with other homes in the same municipality or is priced considerably above the local average. That strengthens your position in negotiations.
It also helps you budget more effectively. If you know what a municipality costs on average per square metre, you can search within a realistic price range. This saves you time on properties that are actually beyond your budget.
A practical method is to note the price per m² of every property you visit, then plot those against the municipal median. Over a few viewings, you build a clear feel for what is fairly priced, what is overpriced and what might represent genuine value. You can also use this approach to compare neighbouring municipalities - sometimes moving your search area by a small distance can unlock a significantly better price without sacrificing much on location or amenities.
How do you use this information as a seller?
As a seller, the price per m² gives you an initial reference for positioning your property on the market. You can see straight away whether your home is in a more expensive or more affordable municipality, and how strongly the local market supports your asking price. This helps you set a price that is neither too high nor too low.
Pricing too high relative to the municipal average is one of the most common mistakes sellers make. Properties that sit on the market for longer than the local average typically end up selling for less, not more - buyers start to wonder why no one else has purchased it. Anchoring your asking price to the local price per m², adjusted for your property's specific strengths, gives you a far stronger starting position.
You should, however, take more into account than the municipal average alone. The condition of the property, its energy performance certificate, the plot size and the quality of finishes can all significantly influence the value. An objective valuation therefore remains essential if you want to sell successfully. A well-timed, well-priced sale consistently outperforms one that starts high and gradually reduces.
Energy performance and price per m²
One factor that is increasingly reflected in the price per m² is the energy performance certificate (EPC) label of a property. Since stricter renovation obligations were introduced in Flanders, and with similar measures discussed in Wallonia and Brussels, properties with a poor EPC rating are facing more visible price pressure at the municipal level.
In practice, two houses in the same municipality with the same surface area can carry a meaningfully different price per m² simply because of their EPC label. A property rated A or B commands a premium; one rated E or F may need to be priced below the municipal median to attract buyers who factor in mandatory renovation costs. For sellers, this makes the EPC label a direct lever on your achievable price per m² - investing in insulation or a heat pump before selling is worth modelling against the likely price uplift.
Municipal data and timing
Property prices by municipality change over time. Statbel publishes data on an annual, half-yearly or quarterly basis, depending on the series. This means you can also follow trends rather than simply looking at a snapshot in time.
This matters, because some municipalities are rising faster than others. Those who track the evolution can see where the market is heating up or cooling down. For sellers, this is useful for choosing the right moment to sell; for buyers, it helps determine whether waiting or acting sooner is the smarter move.
As of autumn 2026, the overall Belgian property market has shown a more moderate pace of price growth compared to the sharp rises seen between 2020 and 2022. Rising interest rates during 2023 and 2024 cooled demand in a number of municipalities, though well-located properties with strong EPC ratings have held their value more firmly. Monitoring the quarterly Statbel releases gives you a clearer read on whether your target municipality is in a phase of acceleration, stabilisation or slight correction.
Limitations of the metric
The price per m² says nothing about residential quality, renovation costs or future returns. A cheap house per square metre can still turn out to be expensive if major works are needed. Conversely, a higher-priced property per m² may well offer more comfort and lower running costs.
It is therefore important not to rely on figures alone. Use the municipal price per m² as a compass, but also look at the full picture. Only then will you get a realistic assessment of the property market.
There is also a statistical limitation worth keeping in mind: in smaller municipalities with fewer transactions per year, the median can shift significantly based on just a handful of sales. A single large villa transaction can push the average up noticeably in a municipality where only twenty houses change hands per year. Always look at sample size alongside the figure itself, and treat small-sample medians with extra caution.
What does this mean for sellers?
For sellers, the municipal price per m² is a strong tool for positioning themselves in the market. You can see what price range buyers are likely thinking in, and how your property compares to other homes in the area. This helps you launch your sale more quickly and more intelligently.
Those who want to go a step further should also have their own property objectively appraised. A good valuation looks not only at the municipality or the price per square metre, but also at the unique characteristics of the property. This makes the sales strategy considerably more precise.
Sellers who combine a data-informed price with a well-presented property - including an updated EPC, quality photographs and a clear description of surface area and layout - consistently achieve better outcomes than those who rely on intuition alone. The municipal price per m² gives you the foundation; the individual characteristics of your property determine whether you land above or below that benchmark.
Practical conclusion
The price per m² by municipality in Belgium is a powerful indicator for anyone looking to buy or sell property. It helps you compare municipalities, property types and regional markets, but works best when combined with a thorough analysis of the actual property. That way, you get a much more complete picture of the market.
Want to know how your property fits within its municipal context? Request a free valuation and translate the figures into a realistic buying or selling strategy.
Frequently asked questions
What is the average price per m² for a house in Belgium in 2026?
Based on Statbel data for the first quarter of 2026, the median price per m² for houses in Belgium varies significantly by region. Flemish municipalities, particularly in the coastal strip and Brussels periphery, tend to sit above the national median, while many Walloon municipalities remain below it. Because the gap between the cheapest and most expensive municipalities can be factor of two or more, always look at your specific municipality rather than a single national average.
Which municipalities in Belgium have the highest price per m²?
Knokke-Heist, Nieuport and Kraainem are consistently cited among the municipalities with the highest price per m² in Belgium. In the Brussels periphery, Wezembeek-Oppem, Tervuren and Lasne also rank near the top. Within Brussels itself, Ixelles and Saint-Gilles carry the highest per-m² prices among the communes.
Which municipalities in Belgium have the lowest price per m²?
The most affordable municipalities by price per m² are generally found in Wallonia, particularly in areas with lower employment density or further from major urban centres. Certain municipalities in Hainaut and Luxembourg province consistently appear at the lower end of the Belgian price spectrum. In Flanders, smaller rural municipalities away from the main axes also tend to offer lower prices per m².
Is the price per m² for apartments higher or lower than for houses in Belgium?
It depends on the municipality. In city-centre and coastal locations, apartments often carry a higher price per m² than houses, because apartments there tend to be more compact and in high-demand locations. In suburban or rural municipalities, houses typically show a higher or comparable price per m². Always compare within the same property type to avoid a distorted reading.
How does the EPC label affect the price per m² of a property in Belgium?
The energy performance certificate has become an increasingly visible factor in transaction prices. In Flanders especially, where renovation obligations are now in force for properties with a poor EPC rating, buyers factor in the cost of mandatory works when making offers. A property with an A or B label can command a premium over the municipal median, while an E or F label property may need to be priced below the median to attract buyers. For sellers, improving the EPC before listing is worth modelling against the likely price uplift.
How often does Statbel update property prices by municipality in Belgium?
Statbel publishes property price data at different intervals depending on the series. Quarterly data is available for broader regional figures, while detailed municipal breakdowns are typically published on a half-yearly or annual basis. For the most current read on your municipality, combining Statbel figures with active listing data from property portals gives the best picture of real-time market conditions.
Can I use the price per m² by municipality to negotiate a property price?
Yes, and it is one of the most practical tools available to buyers in a negotiation. If the asking price per m² for a property sits meaningfully above the municipal median for the same property type, that gap is a concrete and factual starting point for a lower offer. Combining the municipal benchmark with recent comparable sales in the same street or neighbourhood strengthens your position further.
How do I find the price per m² for a specific municipality in Belgium?
Statbel (the Belgian statistical office) is the primary source for official transaction-based price data at municipal level. Their open data portal allows you to filter by municipality, property type and period. For a faster overview, property platforms and valuation tools that aggregate listing and transaction data can give you a quick benchmark, which you can then validate against the official Statbel figures.
Follow us on Google
Pick Immomakelaar Vergelijker as a preferred source and you will see our articles more often in Google, including in AI answers.
Redactie ImmoMakelaarVergelijker
"We write about selling, valuing and costs in Belgium. Articles are drafted with the help of AI from official sources and checked by our team."